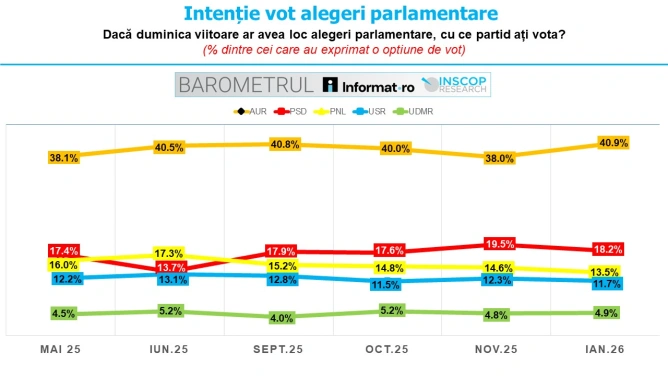
BAROMETRUL Informat.ro - INSCOP Research - Edition VII, January 2026. Chapter 2: Voting intention for parliamentary elections | 40.9% of voters would vote for AUR, 18.2% for PSD, 13.5% for PNL, and 11.7% for USR



Always see our news on Google
BAROMETER Informat.ro - INSCOP Research, Edition VII, January 2026
Chapter 2: Voting Intentions for Parliamentary Elections
According to BAROMETER Informat.ro – INSCOP Research, Edition VII, conducted between January 12-15, AUR leads in the preferences of Romanians for the parliamentary elections.
BAROMETER Informat.ro – INSCOP Research is a monthly opinion poll conducted by INSCOP Research on behalf of the news platform Informat.ro in partnership with the Strategic Thinking Group think tank.
BAROMETER Informat.ro – INSCOP Research aims to bring to the public's attention topics of interest to stimulate national conversations about various subjects and essential public policies for the present and future of Romania, based on the opinions of Romanians in partnership with think tanks and prestigious academic institutions. It is an initiative through which we aim to contribute to the strengthening of democracy by using scientific and credible tools that bring the voice of citizens to the forefront of public debate.
Methodology: Data was collected between January 12-15, 2026. Research method: interview via questionnaire. Data was collected using the CATI method (telephone interviews), with a simple stratified sample volume of 1100 people, representative of significant socio-demographic categories (gender, age, occupation) for the non-institutionalized population of Romania, aged 18 and over. The maximum allowable error of the data is ± 3%, at a confidence level of 95%.
Graphical presentation of the data is available here: BAROMETER Informat.ro - INSCOP Research - Edition VII, January 2026. Chapter 2: Voting Intentions for Parliamentary Elections
Remus Ștefureac – Director INSCOP Research: "The report on voting intentions between the governing parties (cumulative score of 48.3%) and the parliamentary opposition parties (cumulative score of 45.8%) tends to balance at the beginning of 2026, especially as AUR returns to a voting intention of over 40%, after the drop at the end of last year when it reached 38%. However, a rigorous analysis of the evolution of voting intentions over the last 9 months (from May 2025 to January 2026) highlights a remarkable stability for all parties, with month-to-month variations being small and rare. This shows that parties are neither gaining nor losing significantly, despite a period marked by tensions caused by developments in key areas such as economy/prices, fiscal policy/taxes, foreign policy, justice, or security risks/war. We are currently in a rigid political status quo that discourages major political ruptures and crises."
Estimated Voter Participation
On a scale from 1 to 10, where 1 means "definitely not" going to vote and 10 means "definitely yes" going to vote, 22.4% of Romanians chose 1, 1.3% chose 2, 1% chose 3, 2% chose 4, 3.5% chose 5, 1.3% chose 6, 1.9% chose 7. 3.2% indicate 8, 2.6% choose 9, and 58.4% indicate 10. 2.3% do not know or do not answer this question.
Voting Intentions for Parliamentary Elections
Reported for those who expressed a preference for a party on the list, regardless of whether they declare they would definitely vote or not (72% of the total sample)
• 40.9% of voters would vote for AUR (compared to 38% in November, 40% in October, 40.8% in September, 40.5% in June, 38.1% in May 2025).
• 18.2% for PSD (compared to 19.5% in November, 17.6% in October, 17.9% in September, 13.7% in June, 17.4% in May 2025).
• 13.5% for PNL (compared to 14.6% in November, 14.8% in October, 15.2% in September, 17.3% in June, 16% in May 2025).
• 11.7% for USR (compared to 12.3% in November, 11.5% in October, 12.8% in September, 13.1% in June, 12.2% in May 2025).
• 4.9% of voters would vote for UDMR (compared to 4.8% in November, 5.2% in October, 4% in September, 5.2% in June, 4.5% in May 2025).
• 3.4% for SENS (compared to 3.2% in November, 3.4% in October, 2.1% in September, 2.4% in June 2025).
• 1.5% of voters would vote for POT (compared to 3.1% in November, 2.6% in October, 3.3% in September, 4.2% in June 2025)
• 2.8% for SOS Romania (compared to 1.7% in November, 2% in October, 2.8% in September, 1.9% in June 2025).
• 1.1% of voters would give their vote to another party (compared to 1.8% in November, 1.6% in October, 0.6% in September, 0.5% in June 2025)
• 2% express a preference for an independent (1% in November, 1.3% in October, 0.6% in September, 1.4% in June 2025).
Latest News
23:00
22:57
22:53
22:49
22:46
See more news
NEWS ON THE SAME TOPICS
.webp)