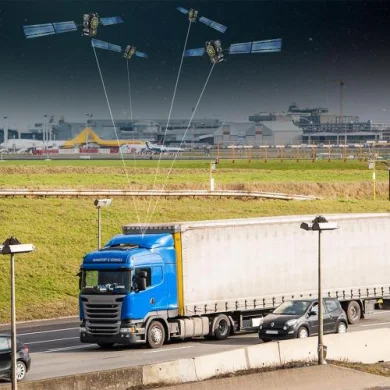



The Copernicus data can show the cities on which streets the trees and green roofs reduce heat the most.


Always see our news on Google
Local authorities can use Copernicus satellite data to identify the streets and neighborhoods most exposed to heat and to decide where trees, green roofs, shade, or the removal of impermeable surfaces can provide the greatest benefits. The European CURE and CLMS Cities projects transform information obtained through Earth observation into tools for urban planning and evaluating adaptation measures.
In short Copernicus data can show temperature differences between neighborhoods, vegetation deficits, and areas where asphalt, concrete, and buildings accumulate and release heat. In cities like London and Paris, the urban center can be about 4°C warmer than neighboring rural areas after dark. During severe heat waves, the difference can reach, under certain conditions, 10–15°C. An analysis conducted in nearly 300 European cities found differences of up to 4°C between tree-covered areas and dense urban fabric in southern Europe and 8–12°C in some Central European cities during extreme summer episodes. A school renovation program in Spain and Portugal reduced indoor temperatures by 4–6°C and electricity consumption for cooling by over 11%, according to information presented by the European agency HaDEA. The CLMS Cities project aims to provide participating cities in the EU Mission for smart and climate-neutral cities with comparable data to verify whether funded interventions work over time.
Cities are often warmer than surrounding rural areas because roads, roofs, facades, and paved surfaces absorb solar energy during the day and gradually release it after sunset. Vegetation can reduce temperature through shading and water evaporation, while building density and reduced air circulation can maintain heat within neighborhoods.
The phenomenon is known as the urban heat island and can vary considerably within the same city. Two neighborhoods located close to each other can have different temperatures depending on the number of trees, materials used in buildings and sidewalks, street width, building density, and the presence of parks or water.
Satellite data allows for the observation of these differences over extensive urban areas without authorities having to rely solely on a limited number of ground-installed sensors. They can be used for mapping surface temperatures, monitoring vegetation, and comparing conditions between neighborhoods.
An image obtained by the Sentinel-3 satellite during the heat wave at the end of June 2026 highlighted the heat island effect in Brussels. Built urban areas appeared warmer than green spaces in the city and surroundings, allowing for the identification of areas where exposure to high temperatures is more pronounced.
The temperature observed at the surface level is not identical to the air temperature felt by residents. However, it provides information about how different materials and land use forms accumulate heat and contribute to the thermal conditions of the neighborhood.
The European Executive Agency for Health and Digitalization shows that the difference between the city center and surrounding rural areas can reach about 4°C at night in cities like London and Paris. During severe heat waves, local contrasts between urban surfaces and cooler areas can be greater, sometimes between 10°C and 15°C.
An analysis based on satellite-measured temperatures in nearly 300 European cities found that tree-covered surfaces can be up to 4°C cooler than dense urban areas in southern Europe. In some Central European cities, the observed differences during extreme summer episodes reached 8–12°C.
The values do not mean that planting trees will automatically reduce air temperature in any neighborhood by the same number of degrees. The results depend on climate, species, crown size, water availability, vegetation density, time of day, and characteristics of nearby buildings.
The data can help authorities decide where intervention is most urgent and where it can protect a larger number of people. Mapping can indicate streets without shade, neighborhoods with few green spaces, areas with extensive impermeable surfaces, and places where air circulation is limited.
In Milan, a thermal risk model based on Copernicus information identified a street with unusually high vulnerability during heat waves. Authorities were able to focus intervention on that specific area instead of applying the same measure across all neighborhoods.
Antwerp introduced requirements for green roofs after thermal maps indicated the most vulnerable areas. Innsbruck used similar analyses to determine where impermeable surfaces need to be removed, where more shade is needed, and where public fountains can provide greater benefits.
A school renovation program in Spain and Portugal reduced indoor temperatures by 4–6°C and associated electricity consumption for cooling by over 11%. The information presented by HaDEA does not detail in the summary document the number of buildings, measurement period, or the separate contribution of each intervention.
The CURE project, funded through Horizon 2020, combined information from the four main Copernicus services and transformed it into ten applications for cities. The tools were tested in ten cities, including Berlin, Copenhagen, and Bristol.
One of the applications mapped thermal comfort at the street level. The goal was for administrations to see the exact location where heat causes the most significant problems without needing to directly interpret complex volumes of satellite data.
CLMS Cities continues this activity and integrates the methods developed through CURE into the Copernicus Land Monitoring Service. The project is funded through Horizon Europe and managed by the European Executive Agency for Health and Digitalization.
The tools are specifically intended for cities participating in the EU Mission for smart and climate-neutral cities. The mission supports cities aiming for climate neutrality by 2030 and their use as testing centers for other European locations.
CLMS Cities would allow for periodic comparison of urban conditions and the results of interventions. Authorities will be able to track whether planted trees develop sufficient coverage, whether green roofs reduce surface warming, and whether changes in materials used on streets produce measurable effects.
The data alone do not determine which project should be funded. The decision depends on local budgets, land ownership, underground infrastructure, mobility needs, vegetation maintenance, and the impact on residents and economic activities.
However, they can provide a comparable basis for setting priorities. Instead of starting only from general impressions about very hot neighborhoods, administrations can compare exposure levels, the number of affected people, and the effectiveness of previously applied measures.
Copernicus is the Earth observation component of the European Union's space program. The system uses satellites, ground-collected data, and analysis models to provide information about the atmosphere, climate, land, marine environment, security, and emergency situations.
The Copernicus Land Monitoring Service provides information about land use, vegetation, and surface changes. The CLMS Cities project aims to adapt such products to the needs of urban administrations so that they can be used without advanced technical expertise in satellite image processing.
Temperature maps must be interpreted together with data on population, health, housing, and access to green spaces. A very hot area is not automatically the area with the highest risk if it is sparsely populated, and more moderate temperatures can have severe effects where many vulnerable people live.

Latest News
23:03
22:56
22:50
22:49
22:41
See more news
NEWS ON THE SAME TOPICS