Before the data on land transport in tourism, Eurostat reported that in 2025, EU passenger rail transport reached a record high: 457 billion passenger-kilometres, 2.6% above 2024. Romania moved in the opposite direction, with an approximately 9% reduction in the number of journeys and a 10.4% decrease in the volume expressed in passenger-kilometres, the largest decline among the reported EU Member States.
Romania has the EU’s highest share of overnight trips made by land, at 94%
2eu.brussels


EU
Foto 2eu.brussels

Always see our news on Google
In 2025, Romania had the highest share in the European Union of overnight trips made by land, at 94%, compared with the European average of 81.4%, according to Eurostat. Cars were the main means of transport for approximately 71.3% of all trips made by residents of Romania, buses and coaches for 13.6%, and trains for 8.9%. The data describe personal and business trips, not all daily journeys made by the population.
In brief Romania leads the land transport ranking. The 94% share is approximately 12.6 percentage points above the EU average; Slovenia, Bulgaria and Czechia follow. Cars also dominate the national breakdown. The figures of 71.3% for cars, 13.6% for buses and coaches, and 8.9% for trains each refer to all overnight trips, not only those made by land. At EU level, air transport accounts for 17.2%, while water transport accounts for 1.4%. Cars have a 63.3% share of the total, trains 13.3%, and buses and coaches 3.8%. A trip has one main means of transport in the statistics. If several are used, Eurostat records the one covering the greatest distance to the main destination. Destination is a separate indicator. Approximately 89% of trips made by residents of Romania were domestic, but this alone does not prove why a particular means of transport was chosen.
Eurostat published the comparison on 19 November, based on approximately 1.2 billion trips made in 2025 by EU residents aged at least 15. It includes personal or business trips involving at least one overnight stay outside the usual environment. Same-day visits and daily commuting are not part of this indicator.
After Romania, the largest shares of land transport were recorded in Slovenia, at 90.4%, Bulgaria, at 89%, and Czechia, at 88.9%. The category comprises cars, trains, buses and coaches, as well as other land-based means of transport. It cannot be interpreted as an exclusive share of private cars.
The tour_dem_tttr dataset records approximately 21.6 million trips by residents of Romania, of which around 20.3 million had a main means of land transport. The breakdown of the same dataset indicates approximately 15.4 million trips by car, 2.94 million by bus and coach, and 1.92 million by train. Relative to the national total, these yield the rounded shares of 71.3%, 13.6% and 8.9%.
The difference from the EU average is not the same for every mode of transport. The share of cars is approximately eight percentage points higher in Romania, while that of buses and coaches is nearly ten points higher. By contrast, trains have a lower share than the European average, at 13.3%. The land category also includes other means, so the three components presented do not exhaust the total.
At the opposite end, air transport has high shares in island states and some small economies: 61.6% in Malta, approximately 51% in Cyprus, 41.8% in Ireland, 38.5% in Luxembourg and 36.6% in Denmark. Water transport reaches 38.4% in Malta, 15.9% in Greece and 6.9% in Finland. These shares reflect the structure of residents’ trips, not the transport used by foreign tourists arriving in those countries.
For trips combining several means of transport, classification is based on the greatest distance travelled to the main destination. A journey by car to an airport followed by a longer flight is therefore recorded as air transport, without implying that the car was not used at all.
A separate statistic, published in October, shows that approximately 89% of trips by residents of Romania had destinations within the country, compared with around 70% at EU level. Destination and the main means of transport describe different dimensions of mobility. The two series alone do not establish the extent to which the choice of transport is determined by distance, cost, infrastructure or preferences.
The unit of measurement is the number of trips. The same person may be counted through multiple journeys in a year, and the percentages do not represent shares of kilometres travelled or transport emissions. The data come from tourism demand statistics, based mainly on surveys; Eurostat warns that respondents’ memory and sampling may influence the estimates.
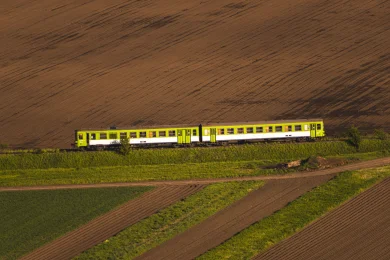
Context: In 2025, trains set a European record, but Romania recorded the largest decrease in the number of journeys
Sources

Latest News
14:40
Trade unions, employers’ associations and the Labour Ministry are negotiating the 2027 minimum wage
14:40
Edge Institute brought together more than 30 experts at Cotroceni Palace / Romania seeks its direction in the AI era and prepares RO Wallet
14:40
DIICOT Hunedoara police officers and prosecutors detained a young man accused of selling high-risk drugs in Simeria
See more news
NEWS ON THE SAME TOPICS



Personalized news feed, AI-powered search, and notifications in a more interactive experience.